Test suite profiling
Recently at $work I found that our test suite was taking longer and longer to run and had begun to slow down development. A long-running test suite smells of bad tests and if one is trying to be agile (or at least flexible, or maybe just trying to do TDD) then this is something which can really put a strain on development and can stop developers using tests as an integrated part of their development process.
I thus decided to do some optimisation to speed things up and thus improve the development experience. Before one optimises, one needs to do some measurement, and (as with production code) this requires profiling. I found the profiling process somewhat instructive (especially how one profiles test suites written in Python) and hence I thought I’d share how I went about this.
Coarse profiling
One can profile code at basically two levels of granularity: fine and coarse. A fine profiling granularity would show how long individual lines of code are taking to run or possibly how long individual functions/methods are taking to run. We’re not really interested in this level of detail at this stage; we’re more interested in how long each test file takes to run, thus coarse profiling is what we want.
Our project uses a fairly standard kind of directory layout for a Python project (the names have been changed to protect the innocent):
main_project_dir/
                 modules/
                 tests/
                 docs/
                 ...
The modules directory contains the production code, the
tests directory contains the tests of the production code and
there are other directories containing other project-related content. Within
the tests/ directory each test file name matches a given
module. E.g. the tests for the jaxa.py module are found in the
test file test_jaxa.py. Such a structure helps developers find
their way around the codebase quickly and makes it possible to run the tests
for a given module by simply running the fairly obviously-named test file.
Often in benchmarking or profiling code one wants to time how long the code runs multiple times and then average the results. This is good if one needs to remove the effects of startup times or maybe the overhead of the Python compiler is something we want to average out of the results. Unfortunately, this isn’t an issue here (it would be nice if it were an issue, as then the test suite would already be quite fast, but that’s not a problem at present…). Fine-grained profiling often requires such techniques; coarse-grained profiling doesn’t really need it. It’s however nice to know that we should do things like this though, and keep it in our toolbox for later.
The basic shell script
We’ll need to do some kind of before-and-after style analysis in order to work out if the optimisations have had any effect. I.e. it is important to time the code before and after an optimisation to make sure it had the effect intended. We therefore want to be able to repeatedly profile our tests at the coarse level. For this it’s handy to use a simple shell script. Here’s the one I developed:
1
2
3
4
5
6
7
8
9
#!/bin/bash

STATS_FILE="test_runtime_stats.dat"
echo "# file runtime" > $STATS_FILE
for file in tests/test_*.py
do
    runtime=$(/usr/bin/time -f "%e" nosetests -q $file |& grep '^[0-9]')
    echo "$file $runtime"
done | tee -a $STATS_FILE
How did I get to here? Sometimes shell scripts look like some form of advanced magic when one sees them as one-off scripts. Naturally I didn’t write this script in one go, it was built in a series of steps. So, just so you get to see my train of thought, here’s the process in detail:
1: $ man time
2: $ for file in tests/test_*.py; do $(/usr/bin/time -f "%e" nosetests -q $file); done
3: $ for file in tests/test_*.py; do $(/usr/bin/time -f "%e" nosetests -q $file); done \
    |& grep '^[0-9]'
4: $ for file in tests/test_*.py; do echo $file; \
    runtime=$(/usr/bin/time -f "%e" nosetests -q $file |& grep '^[0-9]'); \
    echo $runtime; done
5: $ for file in tests/test_*.py; do \
    runtime=$(/usr/bin/time -f "%e" nosetests -q $file |& grep '^[0-9]'); \
    echo "$file $runtime"; done > test_runtime_stats.dat
6: $ for file in tests/test_*.py; do \
    runtime=$(/usr/bin/time -f "%e" nosetests -q $file |& grep '^[0-9]'); \
    echo "$file $runtime"; done | tee test_runtime_stats.dat
7: $ echo "file runtime" > test_runtime_stats.dat; for file in tests/test_*.py; do \
    runtime=$(/usr/bin/time -f "%e" nosetests -q $file |& grep '^[0-9]'); \
    echo "$file $runtime"; done | tee -a test_runtime_stats.dat
8: $ vim test_profile_coarse.sh
9: $ chmod +x test_profile_coarse.sh
At which point I refactored repeated code into variables and formatted the code nicely so that one can read it (code is read more often than it is written), thus ending up at the script shown above. Should I have used TDD to create this script? Well, yes, but I used manual (visual) testing to get to this point and there isn’t a huge gain in having an automated test suite just for this program/script.
Some explanation of my train of thought is in order:
-
The Unix
timecommand allows one to specify the output format. I needed to do a quick look up to see exactly what the syntax was. This is important since I simply want the (user) run time (the%eformatting option) of each test script not the system or total time. -
All that is required is a simple loop over all test files whereby we run each file through
nosetests(http://nose.readthedocs.org/en/latest/) which is effectively just a wrapper around the standardunittestPython testing module (nosetestsmakes testing withunittestmuch easier). We want to use the-q(i.e. quiet) option tonosetestssince we just want run time an no other informative output. -
Even with the quiet option, we still get information about whether or not the tests are all green (i.e. they all pass). We don’t want this, just the time output, which annoyingly turns up on stderr, not stdout, thus we pipe stderr together with stdout
|&andgrepfor lines starting with a number. Thegrephas to happen outside the loop otherwise we still getnosetestsinformation intermingled with timing info. At least this gives us what we want: lines with only timing information. -
The goal of the script in the end is to print the name of the file being run and its runtime on the same line, and then to plot this information as a bar graph. Thus we need to print the file name as part of our script. However, this would get swallowed by the
grep(the line doesn’t start with a number) and so the runtime information is now saved into a variable, and this number as well as the file name are echoed to the terminal. -
Now that the basic ingredients are in place, we now format the output from each test file run into the form we need in the end and pipe the result of the entire for loop into a text file to be later processed by a plotting program such as Gnuplot.
-
There’s one small problem though: it’s not possible to see that something is happening while the script is running (all information is being piped into the file). Feedback that the program is running and doing what is should be doing can be quite comforting, so we use
teeto pipe the output into a file as well as to the terminal. -
The data file needs a header, thus we
echothe header to the file and use the-a(append) option toteeso that we don’t overwrite the header with the data output. -
Now start
vim(or another editor, it doesn’t matter what) and paste the content of the previous shell command into the file. Reformat, name things nicely and generally make things readable for the future. -
Make the script executable so that we don’t have to call it explicitly. So instead of:
bash test_profile_coarse.shwe can simply use./test_profile_coarse.sh.
Running the profiling script now gives the following output:
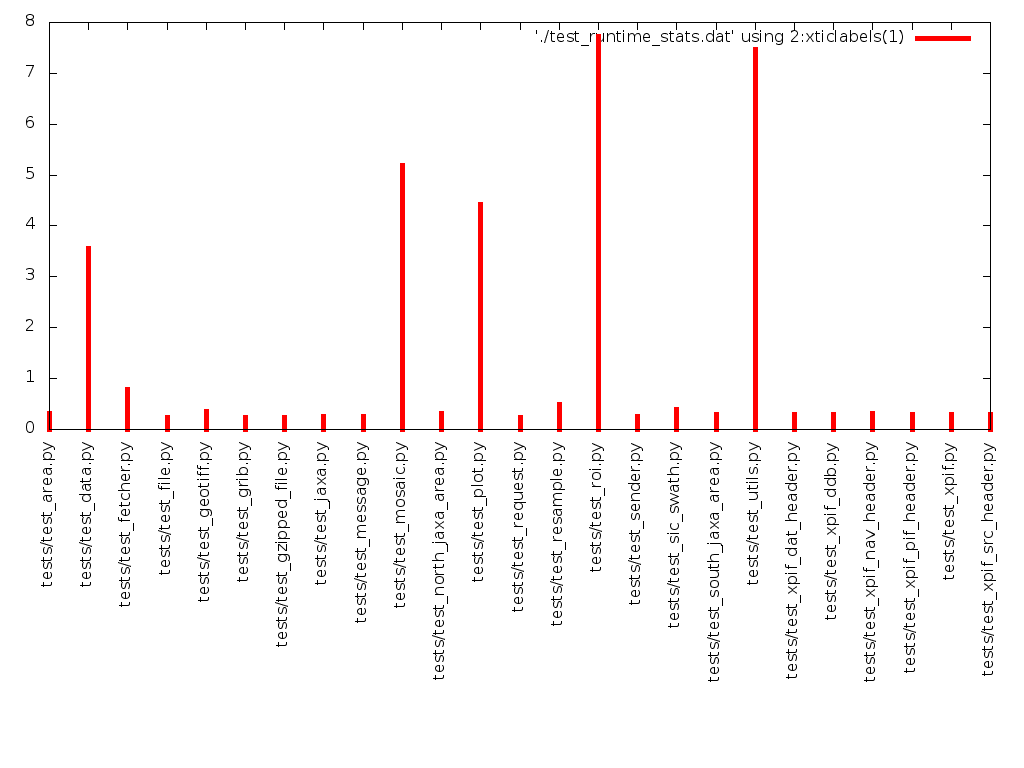
$ ./test_profile_coarse.sh
tests/test_area.py 0.31
tests/test_data.py 3.55
tests/test_fetcher.py 0.79
tests/test_file.py 0.23
tests/test_geotiff.py 0.36
tests/test_grib.py 0.23
tests/test_gzipped_file.py 0.24
tests/test_jaxa.py 0.25
tests/test_message.py 0.26
tests/test_mosaic.py 5.18
tests/test_north_jaxa_area.py 0.31
tests/test_plot.py 4.43
tests/test_request.py 0.24
tests/test_resample.py 0.50
tests/test_roi.py 7.73
tests/test_sender.py 0.26
tests/test_sic_swath.py 0.39
tests/test_south_jaxa_area.py 0.30
tests/test_utils.py 7.46
tests/test_xpif_dat_header.py 0.29
tests/test_xpif_ddb.py 0.29
tests/test_xpif_nav_header.py 0.32
tests/test_xpif_pif_header.py 0.30
tests/test_xpif.py 0.29
tests/test_xpif_src_header.py 0.29
We could format the output to the terminal more nicely, but really, do we need it? Basically, no. What’s more interesting is the visual representation of the data. Actually, it’s now possible to see directly from the numbers which tests we need to optimise, however, a visual representation makes this more obvious.
Visualising the coarse profiling output
Gnuplot is an old standard in the world of scientific data visualisation and is hopefully reasonably familiar, hence we’ll use it here to plot the data. After a bit of trial-and-error with getting the x-axis labels just right, I came up with the following Gnuplot script:
1
2
3
4
5
6
set xtics rotate -90
plot './test_runtime_stats.dat' using 2:xticlabels(1) with impulses lw 5
pause mouse any "Any key or button will terminate\n"
set term png size 1024,768
set output 'test_runtime_stats.png'
plot './test_runtime_stats.dat' using 2:xticlabels(1) with impulses lw 5
This script needs a bit of explanation if you’re not accustomed to Gnuplot.
-
We rotate the tick labels on the x axis by 90 degrees so that they are vertical, not horizontal (the default). The reason being that we want to use the test file names as x axis tick labels, and these will be rather long and the x ticks won’t be readable if we left things as per default.
-
We plot the data initially just to the screen using the default display terminal (in my case it was
wxt, thewxWidgetslibrary, but it’s also quite often simplyx11for X-Windows). Viewing the data directly on the screen is usually what one wants to do, but we also want to plot to file, which we do later in the script. We plot the data in the second column using2:xticlabels(1).xticlabels(1)pulls the filenames out of the data file and uses them as the x axis tick labels. A bar graph (impulses) is a good way to visualise the data we have, and so that we can see the bars, we set the line width (lw) to something which isn’t too thin. -
Next we pause so that the window isn’t simply drawn and disappears without us having the time to see what the data looked like.
-
Now we want to plot the data to file as a PNG file (
set term png) here we specify the size of the output file in pixels (here 1024x768). -
Then we set the output filename.
-
And finally plot everything again. This line actually writes the PNG file. Now we’re finished and are ready to analyse our data.
The output is pretty ugly (see below), but it tells us the information we want to know. Also we got here quickly, with little fuss, and that’s also a positive thing, because the real goal here is to reduce the runtime of the test suite, not (necessarily) to make pretty pictures.
Fine-grained profiling
We can fairly clearly see that test_roi.py and test_utils.py are taking
the most time, so this is where we should focus our initial fine-grained
profiling efforts as well as any initial optimisation effort.
Let’s concentrate specifically on test_roi.py and delve into the details
as to why it’s taking up so much time. We now call on the unittest,
cProfile and pstats Python modules in order to work out these details.
We first start Python (or ipython) and import the unittest module as
well as the test_roi module from our tests package (make sure you have a
__init__.py file in your tests directory for this to work). The test
file needs to be loaded as a module so that we can load the tests contained
in the relevant test class (TestRoi in this case). Then we load the test
class containing the suite of tests we wish to investigate from
test_roi.py:
import unittest
import tests.test_roi
suite = unittest.TestLoader().loadTestsFromTestCase(tests.test_roi.TestRoi)
One can run the test suite on its own like so:
unittest.TextTestRunner().run(suite)which will give output very similar to that which one would obtain by
running the test suite via nosetests on the command line, e.g.
$ nosetests tests/test_roi.pyNow that we can load and run our test suite, we need to profile the code at
a fine level. For this we use the cProfile module (docs: Python
profilers). The cProfile
module measures various statistics about how long or how often a piece of
code was called. Running the test suite from within cProfile prints the
statistics to the console:
import cProfile
cProfile.run('unittest.TextTestRunner().run(suite)')
This gives us lots of detailed information about which functions were
called, which modules were called, how often they were called and how long
they took to run. Basically we’re swamped by detail and we need to filter
out the stuff which really concerns us, namely the calls happening directly
within the test_roi.py file. In order to do this, we save the statistics
out to a file (so that it’s easier to load and manipulate the data)
cProfile.run('unittest.TextTestRunner().run(suite)', 'test_roi.stats')and we call on the pstats module to filter and display the data we’re
interested in. We import the module and load the statistics data.
import pstats
roi_stats = pstats.Stats('test_roi.stats')
By using the sort_stats('cumulative') method we can display all statistics
(output to the console) ordered by their cumulative time. This will tell us
which part is taking the longest.
roi_stats.sort_stats('cumulative').print_stats()There is still lots of noise here. Since we’re just interested in the
execution times of the lines of code running from within test_roi.py we
filter the print_stats() output with the regular expression test_roi*:
roi_stats.sort_stats('cumulative').print_stats('test_roi*')In my case the output looked like this:
Thu Mar 20 16:22:08 2014    test_roi.stats

     33451 function calls in 7.590 seconds

Ordered by: cumulative time
List reduced from 342 to 21 due to restriction <'test_roi*'>

ncalls  tottime  percall  cumtime  percall filename:lineno(function)
    1    0.000    0.000    1.052    1.052 tests/test_roi.py:112(testRoiNamesOutputVariableCorrectly)
    1    0.000    0.000    1.022    1.022 tests/test_roi.py:102(testRoiSavesCorrectDataType)
    1    0.000    0.000    1.009    1.009 tests/test_roi.py:31(testExtractRoiReturnsSelfWithMinimumParameters)
    1    0.000    0.000    1.003    1.003 tests/test_roi.py:39(testExtractRoiSetsRoiFlag)
    1    0.000    0.000    0.998    0.998 tests/test_roi.py:26(testExtractRoiSetsNewLocalFilename)
    1    0.000    0.000    0.899    0.899 tests/test_roi.py:130(testRoiPolarRegionEqualsInitalNorthDataPolarRegion)
    1    0.000    0.000    0.865    0.865 tests/test_roi.py:124(testRoiWillReturnUpdatedDataWhenRunWithParameters)
    1    0.000    0.000    0.655    0.655 tests/test_roi.py:139(testRoiPolarRegionEqualsInitalSouthDataPolarRegion)
    1    0.000    0.000    0.046    0.046 tests/test_roi.py:93(testRoiSavesCorrectDataArray)
   19    0.000    0.000    0.022    0.001 tests/test_roi.py:17(setUp)
    1    0.000    0.000    0.004    0.004 tests/test_roi.py:149(testWriteDataWillCreateFile)
    1    0.000    0.000    0.003    0.003 tests/test_roi.py:81(testRoiOutputArraySize)
    1    0.000    0.000    0.003    0.003 tests/test_roi.py:52(testGetSDSDataReturnsNumpyArray)
    1    0.000    0.000    0.002    0.002 tests/test_roi.py:64(testRoiOutputPathInProductionEnvironment)
    1    0.000    0.000    0.002    0.002 tests/test_roi.py:155(testSdsDataIsDifferentAtTopAndBottom)
    1    0.000    0.000    0.002    0.002 tests/test_roi.py:48(testGetSDSDataAcceptsDataFieldNameArgument)
    1    0.000    0.000    0.001    0.001 tests/test_roi.py:74(testRoiOutputPathReturnsPresetPath)
   19    0.000    0.000    0.000    0.000 tests/test_roi.py:160(tearDown)
    1    0.000    0.000    0.000    0.000 tests/test_roi.py:44(testGetSDSDataRequiresDataFieldNameArgument)
    1    0.000    0.000    0.000    0.000 tests/test_roi.py:58(testRoiOutputPathInTestEnvironment)
    1    0.000    0.000    0.000    0.000 tests/test_roi.py:36(testRoiFlagInitiallyFalse)
Now comes the real fun: trying to work out why the lines of code are taking
too long, and then seeing whether or not we can change (or even delete!) the
tests. An important support tool here is code coverage information: i.e. are
the lines of code I’m changing covered by the test suite? The nosetests
package has a plugin to make generating code coverage information from
Python programs really easy. Essentially we need something like this to see
how well our tests are covering the production code:
$ nosetests --with-coverage --cover-package=<package_name> --cover-erase --cover-htmlYou should use coverage information only as a guide when deciding which tests need to be removed. Each test should be considered carefully and if you do delete a test, make sure that at least the code coverage doesn’t go down!
Back to the task at hand… We don’t really need to plot this information to
see where the problems are; we can see from the cumtime column which line
of code is causing the most issues (i.e. line 112). Now we just need to dig
into the testRoiNamesOutputVariableCorrectly test and see what it’s doing
and trim its fat.
A quick look at the test method and the production code showed up a place
where data was being saved to file each time a Roi() object was being
created (the objects handled by the roi.py module). I/O operations are
slow, and saving this data as part of each object creation was also not 100%
necessary. Thus this is at least one place where we can trim some time from
the overall test suite and make the development experience a little bit more
fluid. Also, we still need to investigate test_utils.py (the other
longest-running test file); there are also a few other modules which have an
over-proportional contribution to the overall test suite run time which need
to be analysed as well. In short, there’s still much to do!
Optimise, rinse, repeat
Here are some options to trim unnecessary run time from the test suite:
- remove superfluous tests (ones that exercise the same code but are supposedly testing different things). The tests should test one small thing and test it well.
- remove unnecessary I/O calls.
- profile and optimise the production code.
If we think we’ve managed to remove bloat from a test suite, we now just repeat the process, looking for other files where lots of time is being used (we can also already see where the other big players are) and it’s simply a matter of “lather, wash, repeat” until the test suite’s runtime is back down to (hopefully) manageable levels.
Recap
Let’s recap:
-
slow tests reduce development speed and give developers an excuse not to use tests for development, which is a Bad Thing.
-
profiling a test suite shows hotspots in test code just as well as it can show hotspots in production code.
-
simple tools (shell scripts, simple graphics packages, modules in Python core) are useful in getting to the final goal: speeding up the test suite (i.e. we don’t need anything fancy).
So was I successful in reducing the overall run time of our test suite?
Well, sort of. In order to remove excess I/O inside the roi.py module,
other more general code needs to be written which would then make the I/O
calls unnecessary. Basically, things turned out to be more complicated to
improve that I first thought. Nevertheless, knowing where the hotspots are
and how much of an impact they have is half the battle. Also, having a test
suite with over 95% coverage of the production code is an invaluable help in
ensuring that nothing gets broken inadvertently in the process of
optimisation. Like I said above, there’s much to do!